Single-line diagrams, solved in your browser.

PowerStudio is a power system analysis workbench. Draw a network, then run load flow, short-circuit, N-1 contingency, stability and electromagnetic transient studies on it. Everything runs on your device: no account, no server, no tracking.

Open PowerStudio Download for offline use One 2147 KB HTML file · version 1.2.0 · MIT licence
  • Drawn with WebGPU, with a Canvas 2D fallback
  • Checked against MATPOWER, pandapower, PowSyBl, ANDES and ngspice
  • Opens CGMES, PSS/E and MATPOWER files
IEEE 14-bus systemNewton-Raphson load flowConverged in 2 iterations
IEEE 14-bus system after a load flow Generator 1 Generator 2 Condenser 3 Condenser 6 Condenser 8 Load 2 Load 3 Load 4 Load 5 Load 6 Load 9 Load 10 Load 11 Load 12 Load 13 Load 14 Capacitor 9 Bus 1 Bus 2 Bus 3 Bus 4 Bus 5 Bus 6 Bus 7 Bus 8 Bus 9 Bus 10 Bus 11 Bus 12 Bus 13 Bus 14 1.070 p.u. −14.22° 1.062 p.u. −13.36° 1.090 p.u. −13.36° 1.060 p.u. 0.00° 1.045 p.u. −4.98° 1.010 p.u. −12.73° 1.018 p.u. −10.31° 1.020 p.u. −8.77° 1.056 p.u. −14.94° 1.051 p.u. −15.10° 1.057 p.u. −14.79° 1.055 p.u. −15.08° 1.050 p.u. −15.16° 1.036 p.u. −16.03° P 232.4 MW Q −16.5 Mvar P 40.0 MW Q 43.6 Mvar P 0.0 MW Q 25.1 Mvar P 0.0 MW Q 12.7 Mvar P 0.0 MW Q 17.6 Mvar Q 21.18 Mvar 72.5 % 52.0 % 61.4 % 52.2 % 38.8 % 23.1 % 45.3 % 33.4 % 33.4 % 52.2 % 27.8 % 41.8 % 17.1 % 9.8 % 32.8 % 50.5 % 53.9 % 76.4 % 58.7 % 47.8 % 156.9 MW −20.4 Mvar −152.6 MW 27.7 Mvar 75.5 MW 3.9 Mvar −72.7 MW 2.2 Mvar 73.2 MW 3.6 Mvar −70.9 MW 1.6 Mvar 56.1 MW −1.6 Mvar −54.5 MW 3.0 Mvar 41.5 MW 1.2 Mvar −40.6 MW −2.1 Mvar −23.3 MW 4.5 Mvar 23.7 MW −4.8 Mvar −61.2 MW 15.8 Mvar 61.7 MW −14.2 Mvar 7.4 MW 3.6 Mvar −7.3 MW −3.4 Mvar 7.8 MW 2.5 Mvar −7.7 MW −2.4 Mvar 17.7 MW 7.2 Mvar −17.5 MW −6.8 Mvar 5.2 MW 4.2 Mvar −5.2 MW −4.2 Mvar 9.4 MW 3.6 Mvar −9.3 MW −3.4 Mvar −3.8 MW −1.6 Mvar 3.8 MW 1.6 Mvar 1.6 MW 0.8 Mvar −1.6 MW −0.7 Mvar 5.6 MW 1.7 Mvar −5.6 MW −1.6 Mvar 28.1 MW −9.7 Mvar −28.1 MW 11.4 Mvar 16.1 MW −0.4 Mvar −16.1 MW 1.7 Mvar 44.1 MW 12.5 Mvar −44.1 MW −8.0 Mvar 0.0 MW −17.2 Mvar 0.0 MW 17.6 Mvar 28.1 MW 5.8 Mvar −28.1 MW −5.0 Mvar
Drawn when this page was built, from the same display list the app renders: every busbar voltage, branch loading and machine output is the engine's result (272.4 MW generated, 13.393 MW lost).

Five studies, one diagram

The calculations a network engineer runs every day

Each study reads the same network you draw, runs in a background worker so the diagram stays responsive, and puts its results back on the diagram, in sortable tables and in the inspector. The figures below are the bundled IEEE 14-bus sample, computed when this page was built.

Load flow

Newton-Raphson on sparse matrices, with regulating tap changers, phase shifters and switched shunts, remote voltage control, reactive limits, distributed slack and area interchange.

13.393 MWlosses, converged in 2 iterations

Short circuit

IEC 60909-style three-phase, line-to-line and earth faults, maximum and minimum, with peak, breaking and thermal currents, power station units, motors and converter-fed sources.

27.35 kAhighest Ik″, at Bus 8

N-1 contingency

Every line, transformer or machine out in turn, plus your own multi-element contingencies and remedial actions, ranked by the limits they break.

10 of 20outages break a limit; losing Line 1-2 loads Line 1-5 to 181 %

Stability

Electromechanical simulation with round-rotor machines, exciters, governors and stabilisers: faults, clearing, tripping and load steps, plotted over time.

Stays in step5 machines through a fault at Bus 4 cleared in 80 ms by tripping Line 4-5

Electromagnetic transients

Three-phase waveforms at a microsecond step: lines as travelling waves, transformers by their vector group, faults of every kind, and breaker poles that open at their current zeros.
12.8 kApeak current into a three-phase fault at Bus 4, DC offset included, cleared at its current zeros
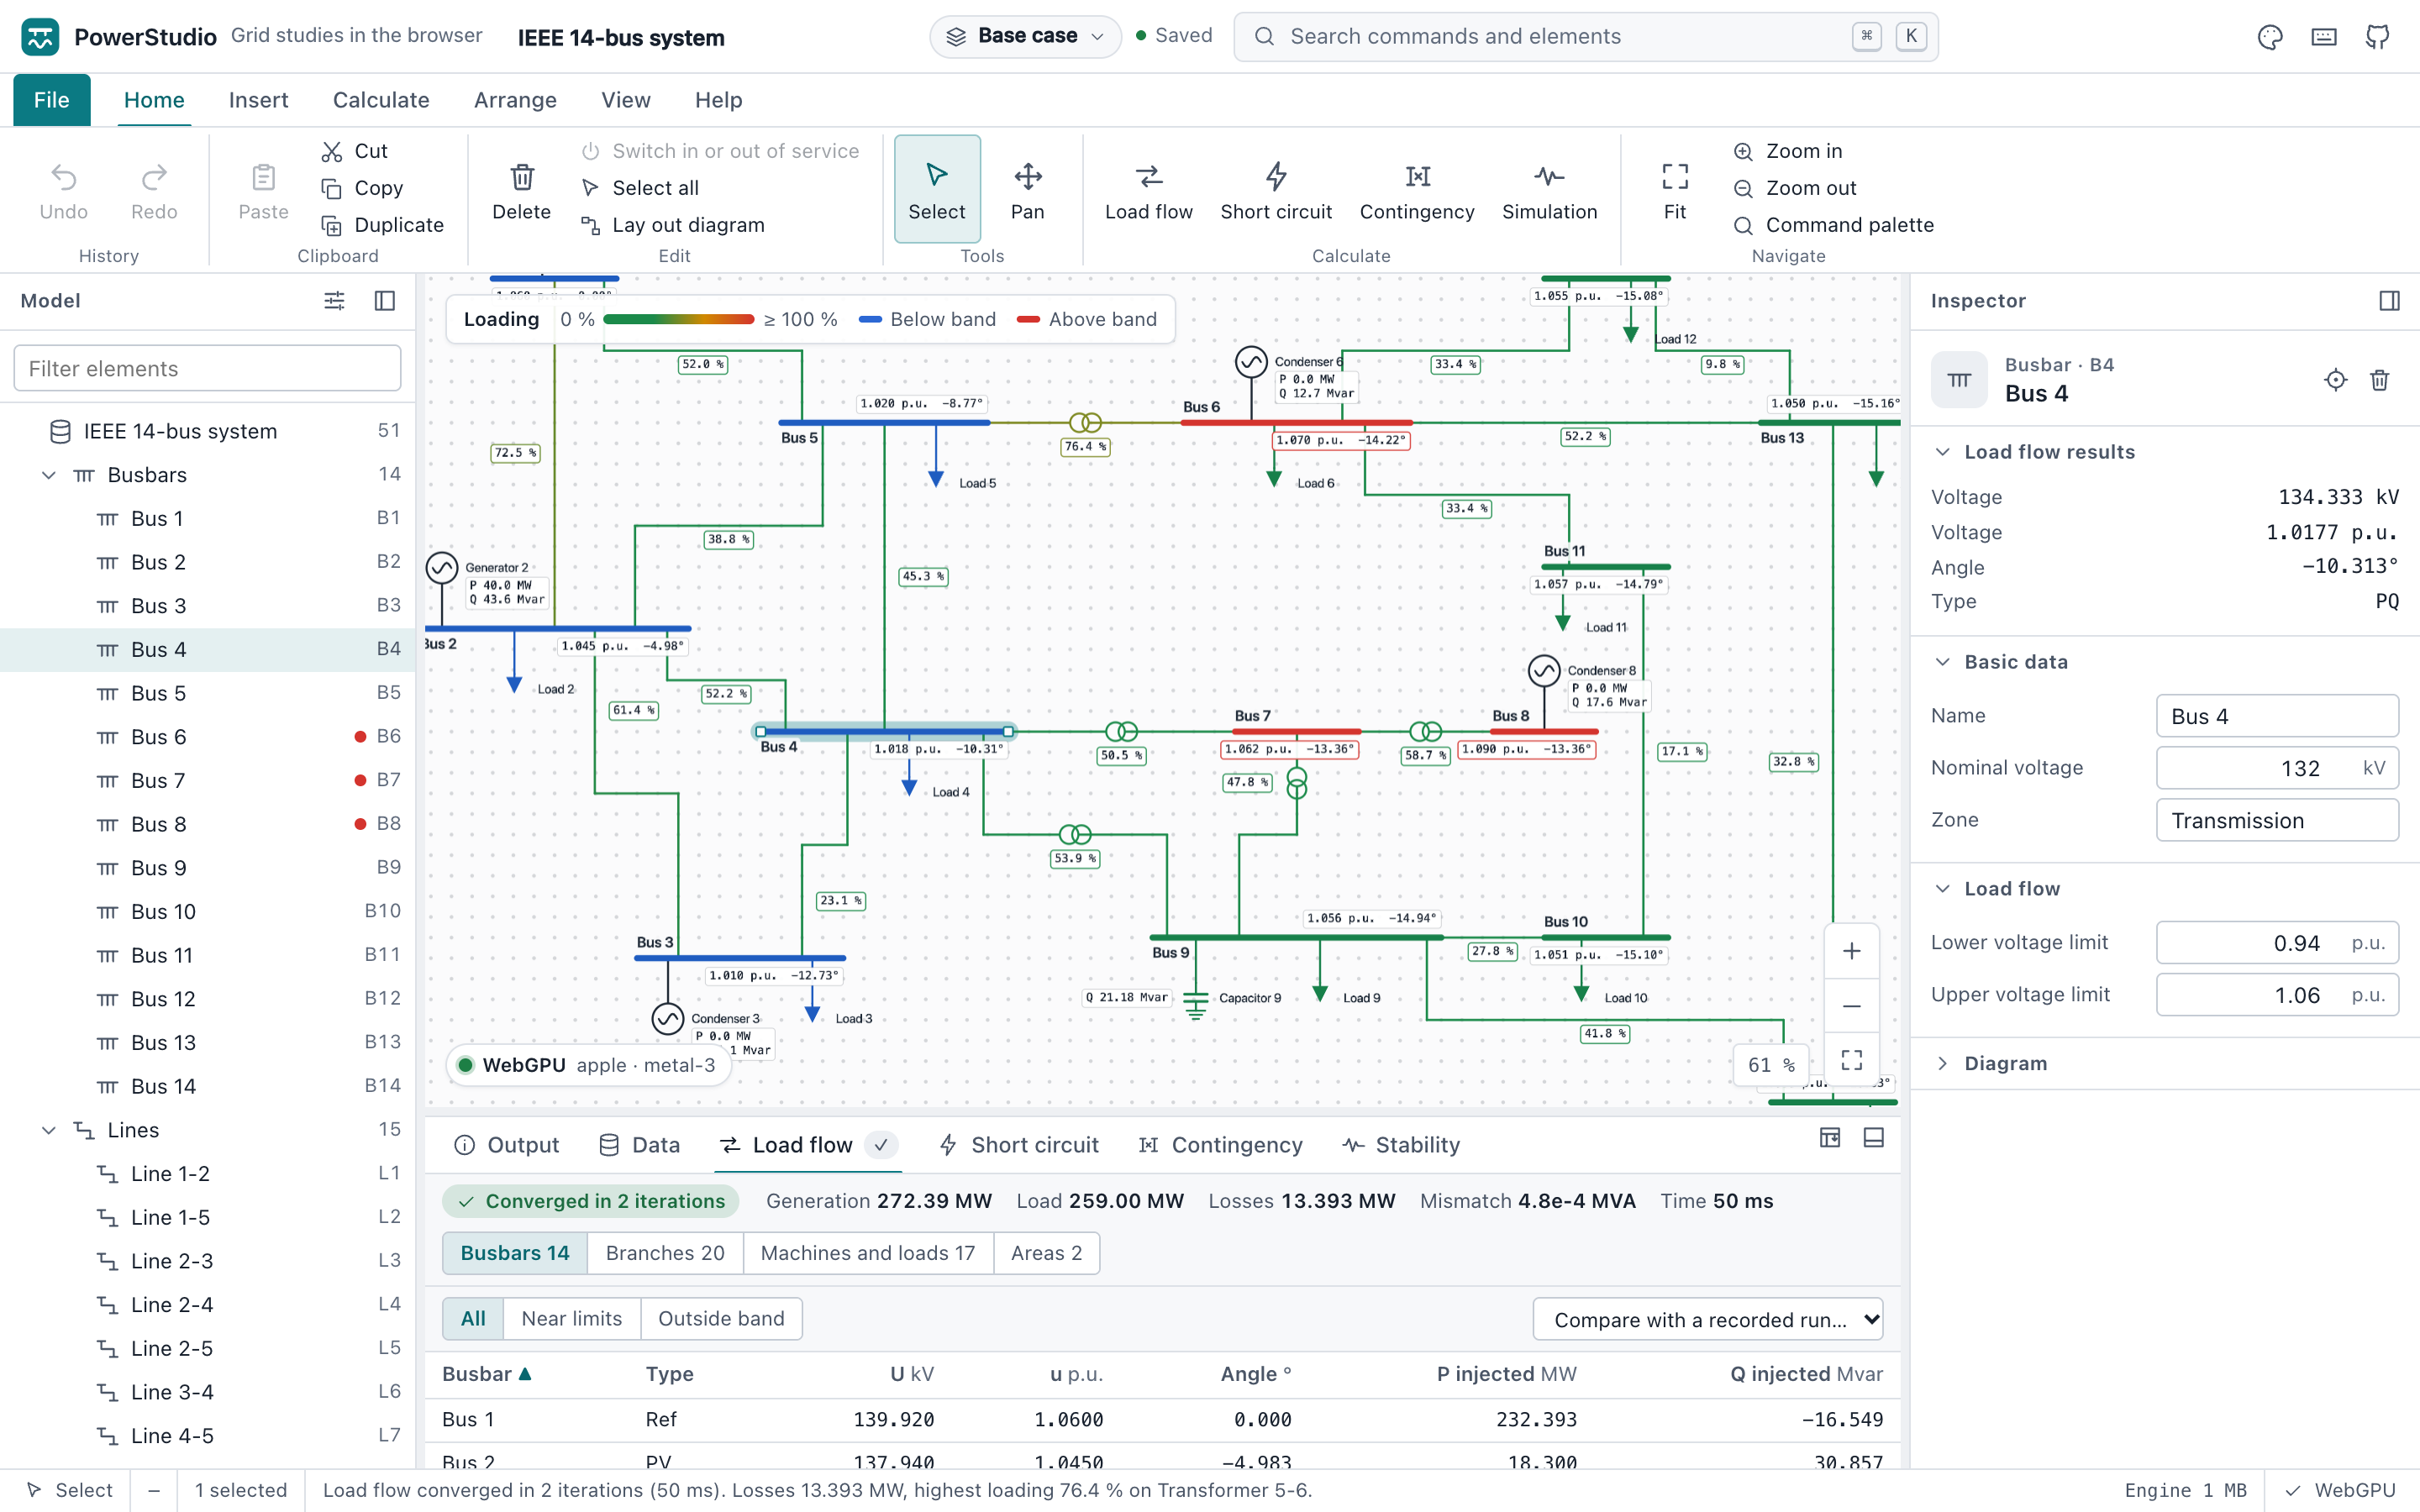
The PowerStudio workspace after a load flow on the IEEE 14-bus system: ribbon, model tree, diagram with loading colours and result boxes, inspector and the busbar results table.
A screenshot of the running app, drawn with WebGPU.

A workspace built for the job

Familiar layout, made for the browser

  • Ribbon, model tree, diagram and inspector. Every element's data is grouped by the study it feeds, with units and limits.
  • Edit on the diagram. Snap busbars into line with guides, align and distribute them, shape routes that stay square or route them around obstacles, and find your way with an overview map.
  • Readable results. Names and result boxes are placed clear of each other, with a leader where one has to move away; drag any of them where you want it.
  • Results where you look. Loading and voltage colours, result boxes, sortable tables and charts of voltage profiles, loadings and fault currents, CSV export, and results marked stale after an edit.
  • Fast to drive. A command palette, keyboard shortcuts for every study, undo and redo for every change, light and dark themes, and a getting-started guide that walks through every study in 30 minutes.
  • Projects. Study cases, scenarios and variants, a run log with the hashes of every result, and a spreadsheet for every element class.
  • Your files. Open CGMES, PSS/E RAW with DYR, and MATPOWER files; export projects (encrypted if you like), the operating point as CGMES, a study report, SVG, PNG and CSV.

Verification

Checked against independent solvers, not against itself

The engine's tests compare its results with independent programs and published references on the same networks. The first rows are recomputed when this page was built; the others give the tolerance the tests require.

WhatReferenceLargest difference
Load flow on MATPOWER case14, case30 and case118, imported from their filesBus voltages, all busesMATPOWER's algorithm (PYPOWER)8.9 × 10⁻¹² p.u.
Load flow on both samples, with and without reactive limitsVoltages, branch flows and machine outputspandapower1.2 × 10⁻¹² p.u.
Short circuit, three-phase and line-to-line, maximum and minimumIk″, ip and Ith at every busbarpandapower's IEC 609091.3 × 10⁻¹⁵ relative
Short circuit, line-to-earth, maximum and minimumIk″ at every busbarpandapower's IEC 609091.7 × 10⁻⁸ relative
Short circuit on the IEC TR 60909-4 example networkIk″, ip and Sk″, power station units and earth faults includedThe report's valueswithin 0.001 kA
CGMES and PSS/E imports and their load flows12 CGMES configurations, 23 RAW filesPowSyBlwithin 1e-6 p.u.
Stability with machine controlsRotor angles on ANDES's published casesANDESwithin 2e-3 rad
EMT on five fault and switching casesPhase voltages, and branch, source and fault currents, on both samples and a 100 km linengspicewithin 5e-3 of crest

The short-circuit calculation follows the method of IEC 60909-0 as pandapower implements it; it is not certified against the standard. The full test report, with environments and every number, is in docs/TEST-REPORT.md.

Local-first

Your network never leaves your machine

No account, no server

Networks save to your browser's storage as you work. There is nothing to sign up for and nothing is uploaded.

Network access is switched off

The app's Content-Security-Policy sets connect-src 'none', so the page cannot send data anywhere, by design and by test.

One file, offline

The whole app is a single 2147 KB HTML file. Download it, open it from disk, and it runs without a connection.

Scope

What it is, and what it is not

PowerStudio is a capable study tool, not a validated engineering product. Check results that matter with a validated tool.

The full list is in the Scope and boundaries section of the README.

Open a sample and run a load flow

The IEEE 14-bus system opens on first start. Press Alt+L and the network is solved.